More languages
More actions
Media in category "Line charts"
The following 34 files are in this category, out of 34 total.
-
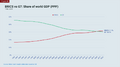 BRICS vs G7 GDP PPP.png 950 × 534; 87 KB
-
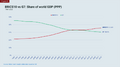 BRICS10 vs G7 GDP PPP.png 950 × 534; 88 KB
-
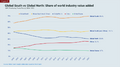
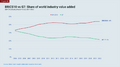 BRICS10 vs G7 value added.png 950 × 534; 85 KB
-
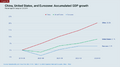 China USA Eurozone GDP graph.png 950 × 534; 98 KB
-
 China vs USA net fixed capital graph.png 950 × 534; 91 KB
-
 China vs USA world GDP.png 950 × 534; 94 KB
-
 Declining GDP growth.png 725 × 396; 55 KB
-
 EAP and GDP growth.png 934 × 456; 41 KB
-
 Food Price Index graph.png 920 × 488; 29 KB
-
 Global GDP graph from 1500.jpg 605 × 348; 106 KB
-
 Global industrial workforce.png 852 × 422; 23 KB
-
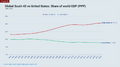 Global South 43 vs USA.png 950 × 534; 98 KB
-
 Global South manufacturing exports.png 939 × 566; 42 KB
-
 Global South manufacturing imports.png 930 × 526; 34 KB
-
 Japanese deflation graph.png 720 × 501; 57 KB
-
 Labor income vs gross output.png 964 × 555; 92 KB
-
 Labor productivity vs cost.png 961 × 667; 26 KB
-
 Manufactured exports.png 951 × 579; 56 KB
-
 MVA and export growth.png 647 × 351; 21 KB
-
 MVA vs exports.png 854 × 460; 24 KB
-
 North South FDI.png 941 × 498; 48 KB
-
 Output per worker graph.png 962 × 550; 140 KB
-
 Per capita GDP by country.png 1,699 × 899; 372 KB
-
 PPP anomaly vs GDP per capita.png 1,508 × 747; 86 KB
-
 Purchasing power anomaly.png 959 × 538; 41 KB
-
 South vs North GDP PPP.png 950 × 534; 93 KB
-
 South without China vs North GDP PPP.png 950 × 534; 99 KB
-
 TRPF graph.png 425 × 274; 55 KB
-
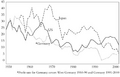
 UK current account 1885 to 1945.png 950 × 534; 86 KB
-
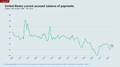 USA current account graph.png 950 × 534; 100 KB
-
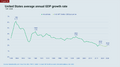 USA GDP growth rate.png 950 × 534; 95 KB
-
 Value added graph PPP.png 950 × 534; 127 KB
-
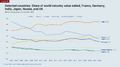 Value added six countries.png 950 × 534; 135 KB
-
 World population graph since 10000 BCE.svg 850 × 600; 32 KB


