More languages
More actions
Size of this preview: 800 × 523 pixels. Other resolution: 900 × 588 pixels.
Original file (900 × 588 pixels, file size: 206 KB, MIME type: image/jpeg)
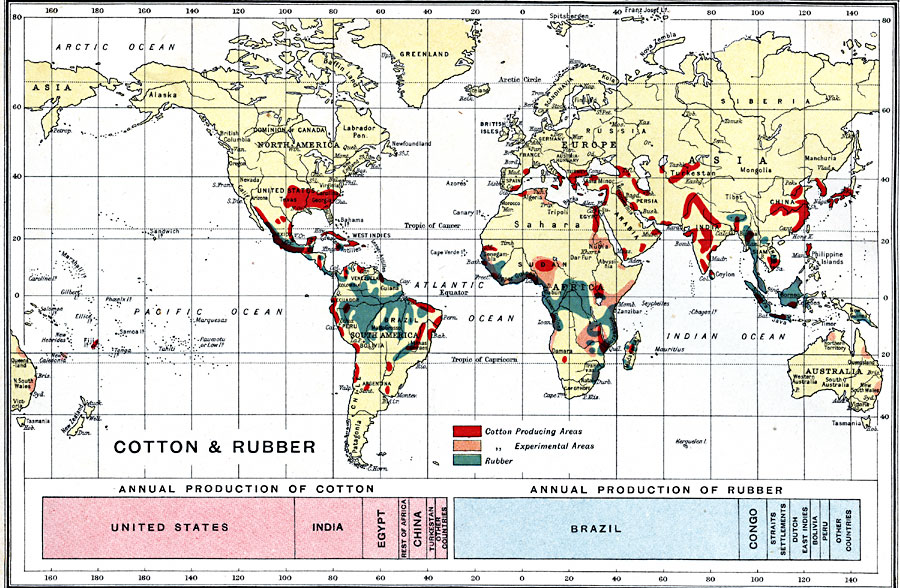
A 1915 world map highlighting regions of cotton production (shown in red) and rubber production (shown in blue). Also shows "experimental" cotton areas, highlighted in pink.
Source: J.G. Bartholomew, A School Economic Atlas (London, England: Oxford University Press, 1915). URL: https://etc.usf.edu/maps/pages/400/467/467.htm
File history
Click on a date/time to view the file as it appeared at that time.
| Date/Time | Thumbnail | Dimensions | User | Comment | |
|---|---|---|---|---|---|
| current | 07:14, 21 December 2025 | | 900 × 588 (206 KB) | Verda.Majo (talk | contribs) |
You cannot overwrite this file.
File usage
The following page uses this file: