More languages
More actions
No edit summary |
mNo edit summary Tag: Visual edit |
||
| Line 1: | Line 1: | ||
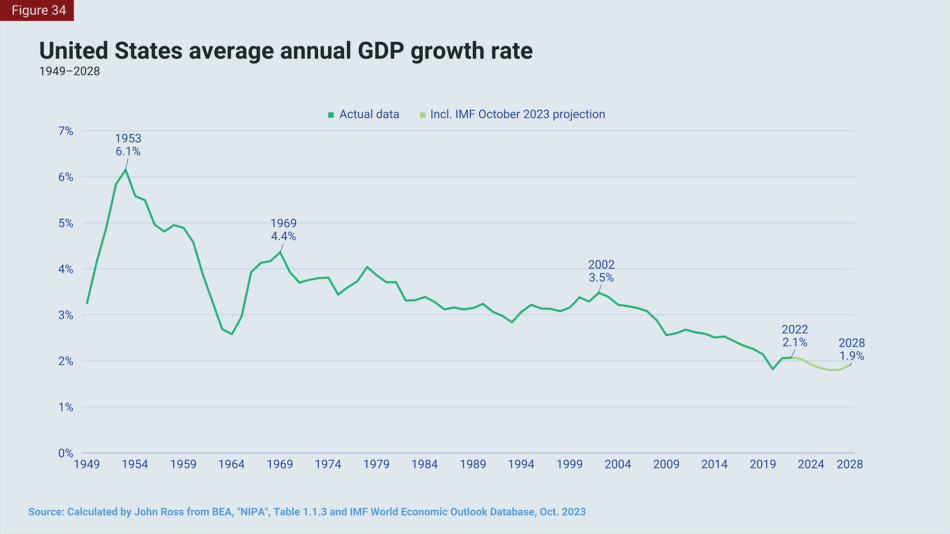
Graph of USA GDP growth rate from 1949 to 2023 with an [[IMF]] projection for 2023 to 2028 | Graph of USA GDP growth rate from 1949 to 2023 with an [[IMF]] projection for 2023 to 2028 | ||
[[Category:Line charts]] | |||
Latest revision as of 18:59, 3 February 2024
Graph of USA GDP growth rate from 1949 to 2023 with an IMF projection for 2023 to 2028
File history
Click on a date/time to view the file as it appeared at that time.
| Date/Time | Thumbnail | Dimensions | User | Comment | |
|---|---|---|---|---|---|
| current | 18:58, 3 February 2024 |  | 950 × 534 (95 KB) | Ledlecreeper27 (talk | contribs) |
You cannot overwrite this file.
File usage
There are no pages that use this file.
